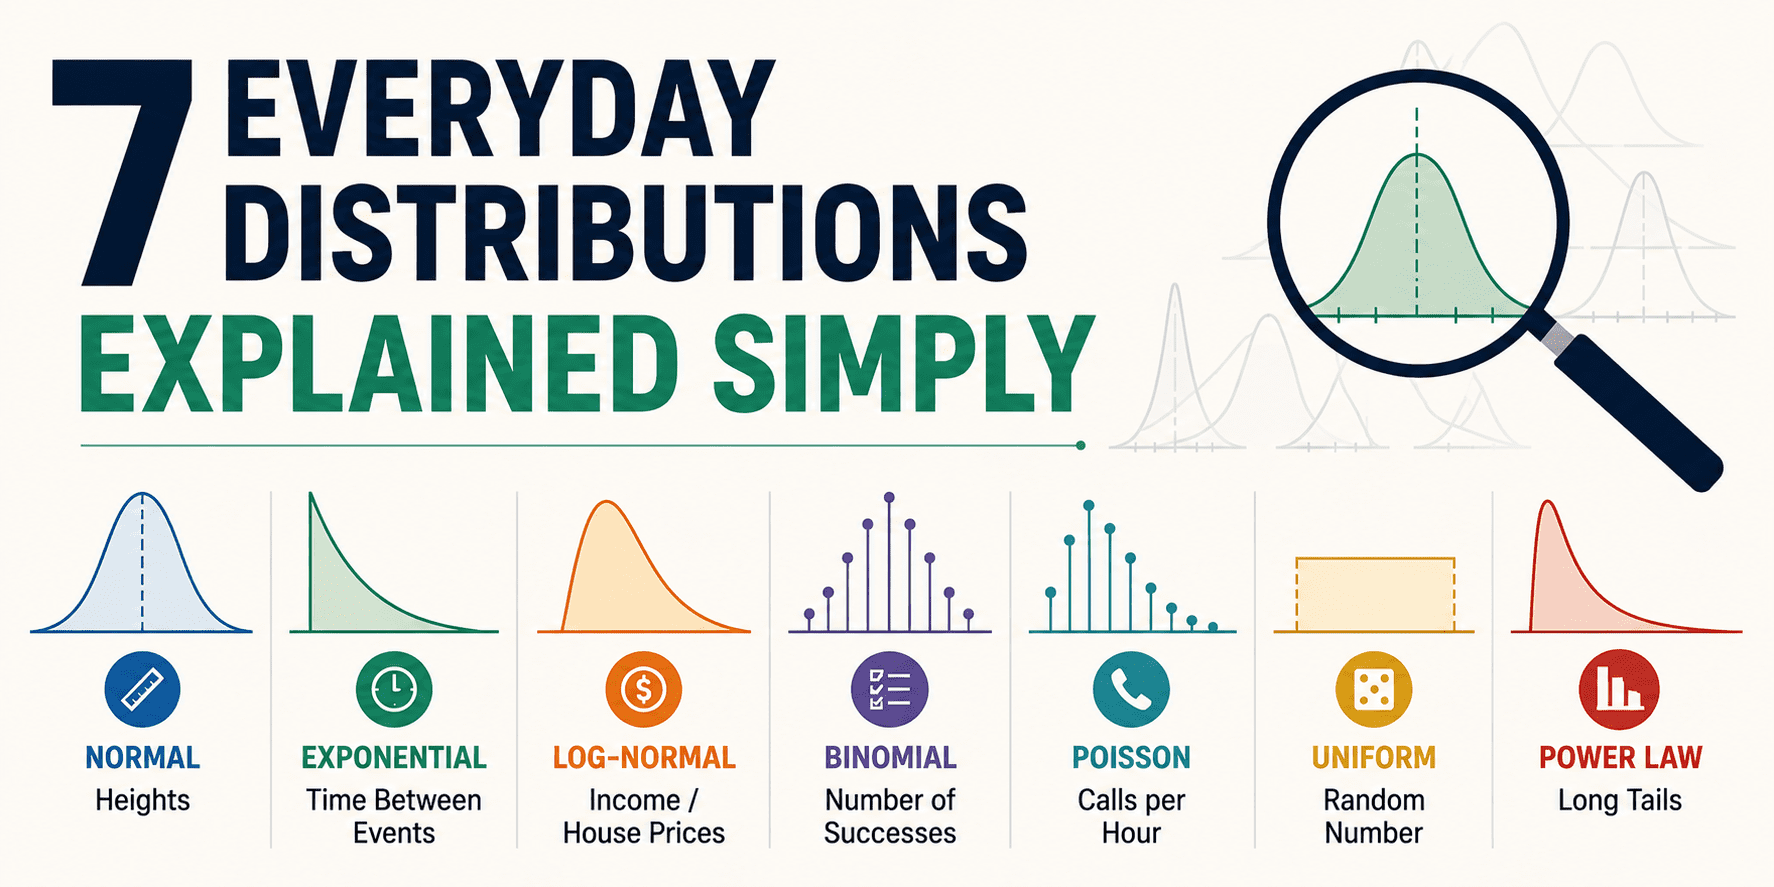
# The Plot Thickens You've probably heard someone say "that's a normal distribution" like it's a magic spell that explains everything. Truth is, distributions are just stories about how numbers tend to show up in real life. Some stories are smooth curves. Some are lumpy. Some are basically a coin flip with better branding. This article is a quick, everyday tour of seven distributions you'll actually recognize once you know what to look for. No heavy math. No gatekeeping. Just the vibe of: "Ohhh, that's why those numbers behave like that." Once you start spotting these patterns, stats stops feeling like a school subject and starts feeling like a cheat code for interpreting the world. # 1. Normal Distribution The "Most Things Cluster in the Middle" Curve The normal distribution is the classic bell curve. It shows up when a value is shaped by lots of tiny, independent influences that nudge it up or down.…