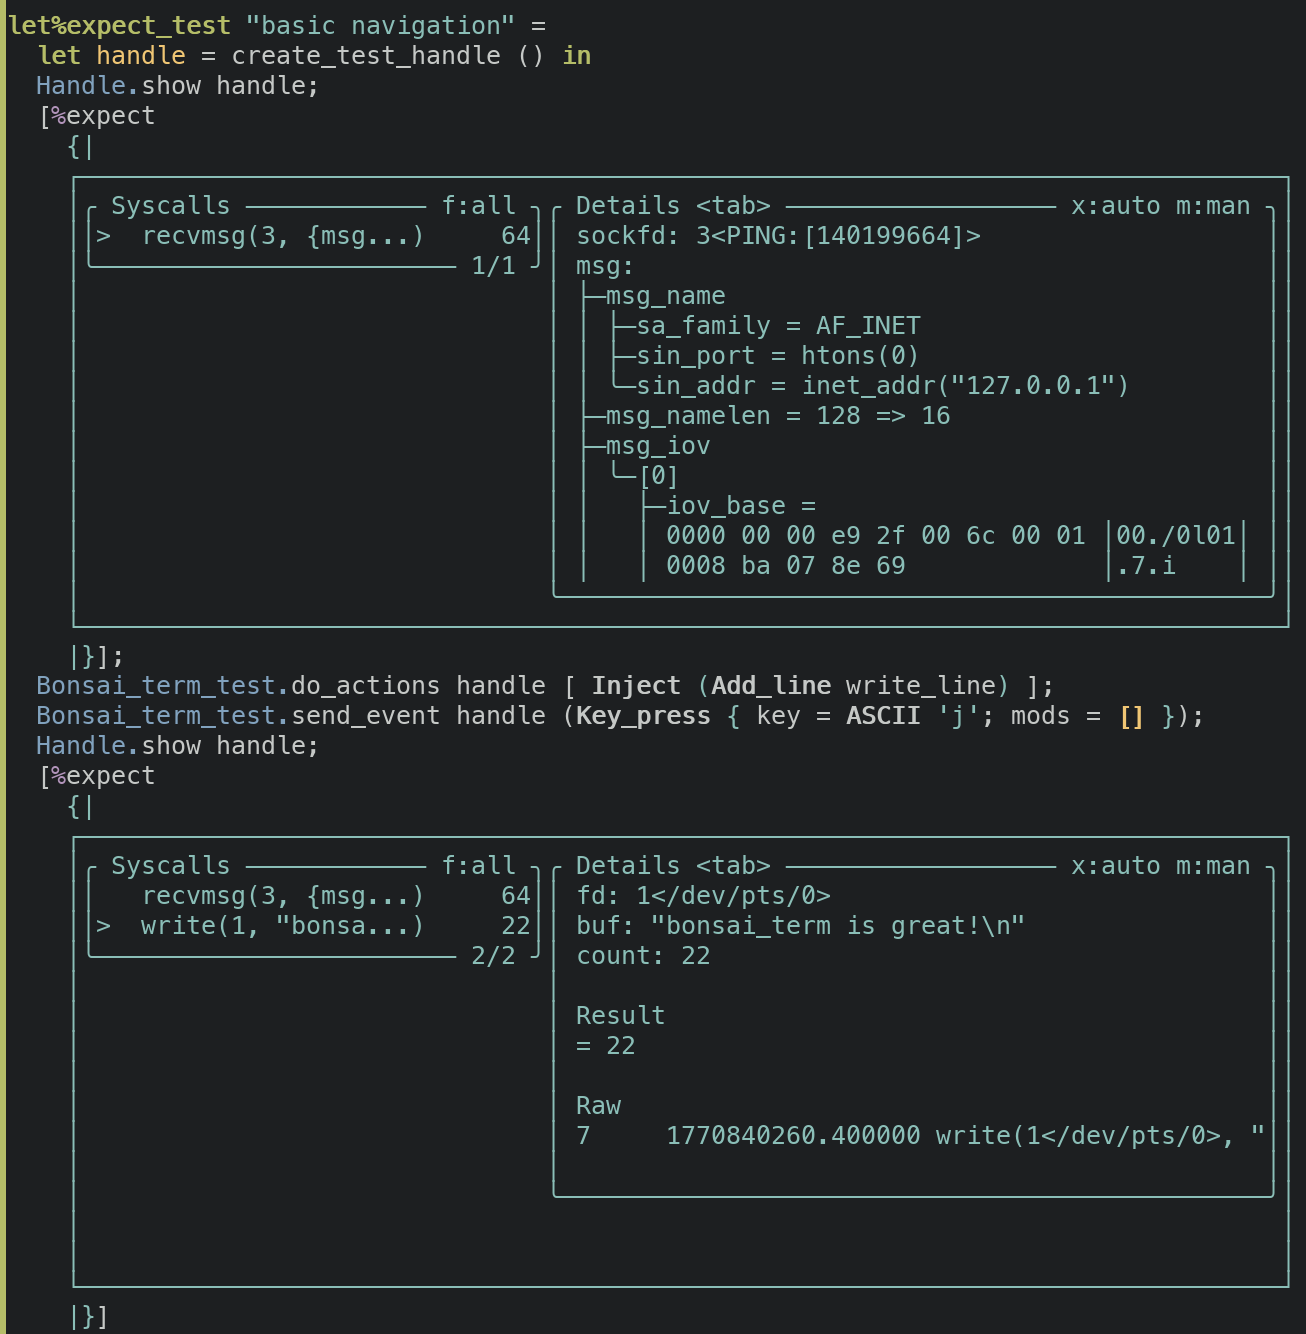
We’ve always found strace useful but somewhat hard to work with. Its output is often inscrutable, it’s hard to follow subprocesses or threads, and if you want to filter syscalls you have to rerun the trace with a flag for each one. What you want in debugging is a tool for exploring, refining, etc., but strace can make this difficult. Enter strace-ui, which turns strace into an interactive terminal UI: strace-ui assigns short IDs to PIDs to make them easier to scan, formats structs, and renders buffers as hexdumps instead of strings. It has some other nice features that you can’t see in the screenshot: Interactive filtering. Tracing an async OCaml process? Did you forget to pass -e '!futex,timerfd_settime,epoll_wait' ? Don’t worry: press h to hide any syscall you don’t care about. Trace a particular file-descriptor. Press > or < to jump to the next/previous syscall that referenced the same file descriptor, or press F to change your filter to only include syscalls that touch a given FD.…