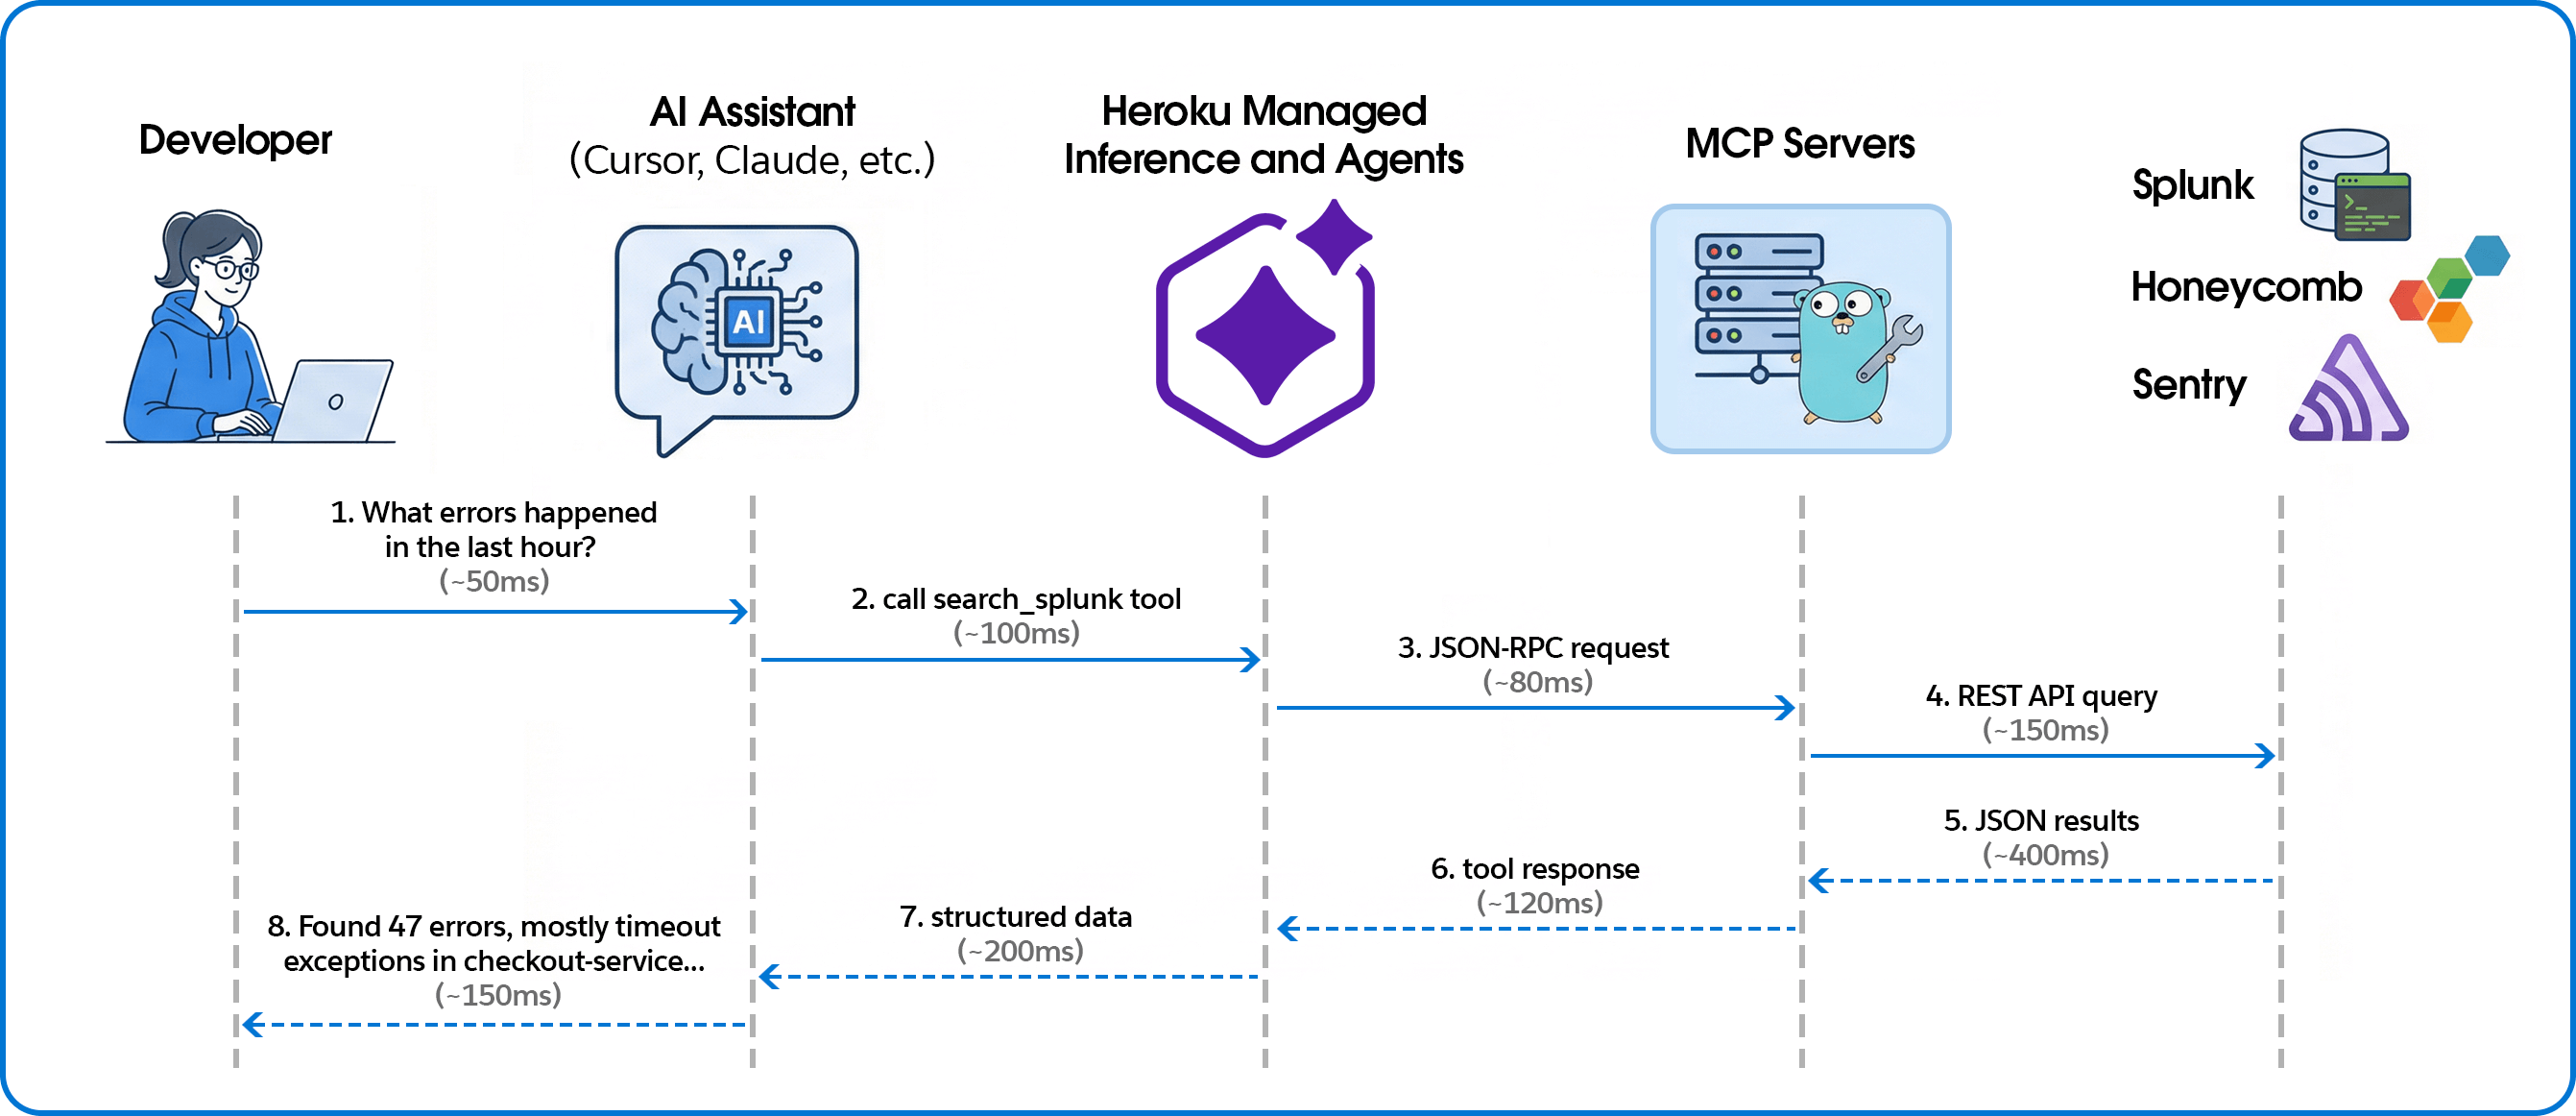
If you’ve ever debugged a production incident, you know the drill: IDE on one screen, Splunk on another, Sentry open in a third tab, frantically copying error messages between windows while your PagerDuty keeps buzzing. You ask “What errors spiked in the last hour?” but instead of an answer, you have to context-switch, recall complex query syntax, and mentally correlate log timestamps with your code. By the time you find the relevant log, you’ve lost your flow. Meanwhile the incident clock keeps ticking away. The workflow below fixes that broken loop. We’ll show you how to use the Model Context Protocol (MCP) and Heroku Managed Inference and Agents to pipe those observability queries directly into your IDE, turning manual hunting into instant answers. Connecting telemetry to code for AI-powered observability The system connects AI coding assistants to observability platforms through the Model Context Protocol (MCP), with Managed Inference and Agents handling the transport layer.…