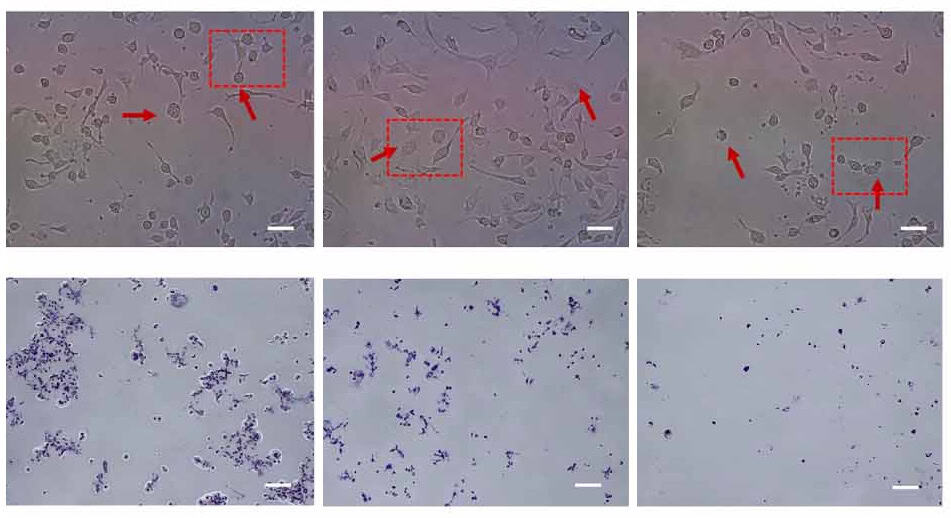
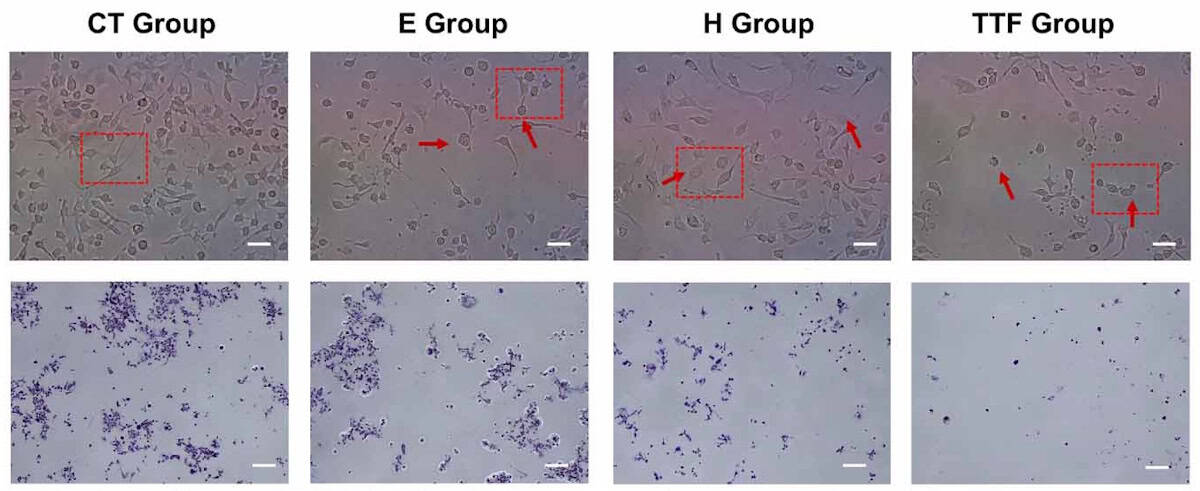
Separating cell-death mechanisms Top row: brightfield images showing glioblastoma cell morphology under control (CT), pure electric field (E), pure thermal field (H) and TTFields (TTF) conditions. Red arrows indicate notable morphological changes; scale bar, 50 µm. Bottom row: cells stained for viability assessment under the same conditions; scale bar, 500 µm. (Courtesy: Phys. Med. Biol. 10.1088/1361-6560/ae5d81)" title="Click to open image in popup" href="https://physicsworld.com/wp-content/uploads/2026/05/6-05-26-ttfields-fig5ac.jpg"> Separating cell-death mechanisms Top row: brightfield images showing glioblastoma cell morphology under control (CT), pure electric field (E), pure thermal field (H) and TTFields (TTF) conditions. Red arrows indicate notable changes; scale bar, 50 µm. Bottom row: cells stained for viability assessment under the same conditions; scale bar, 500 µm. (Courtesy: Phys. Med. Biol.…