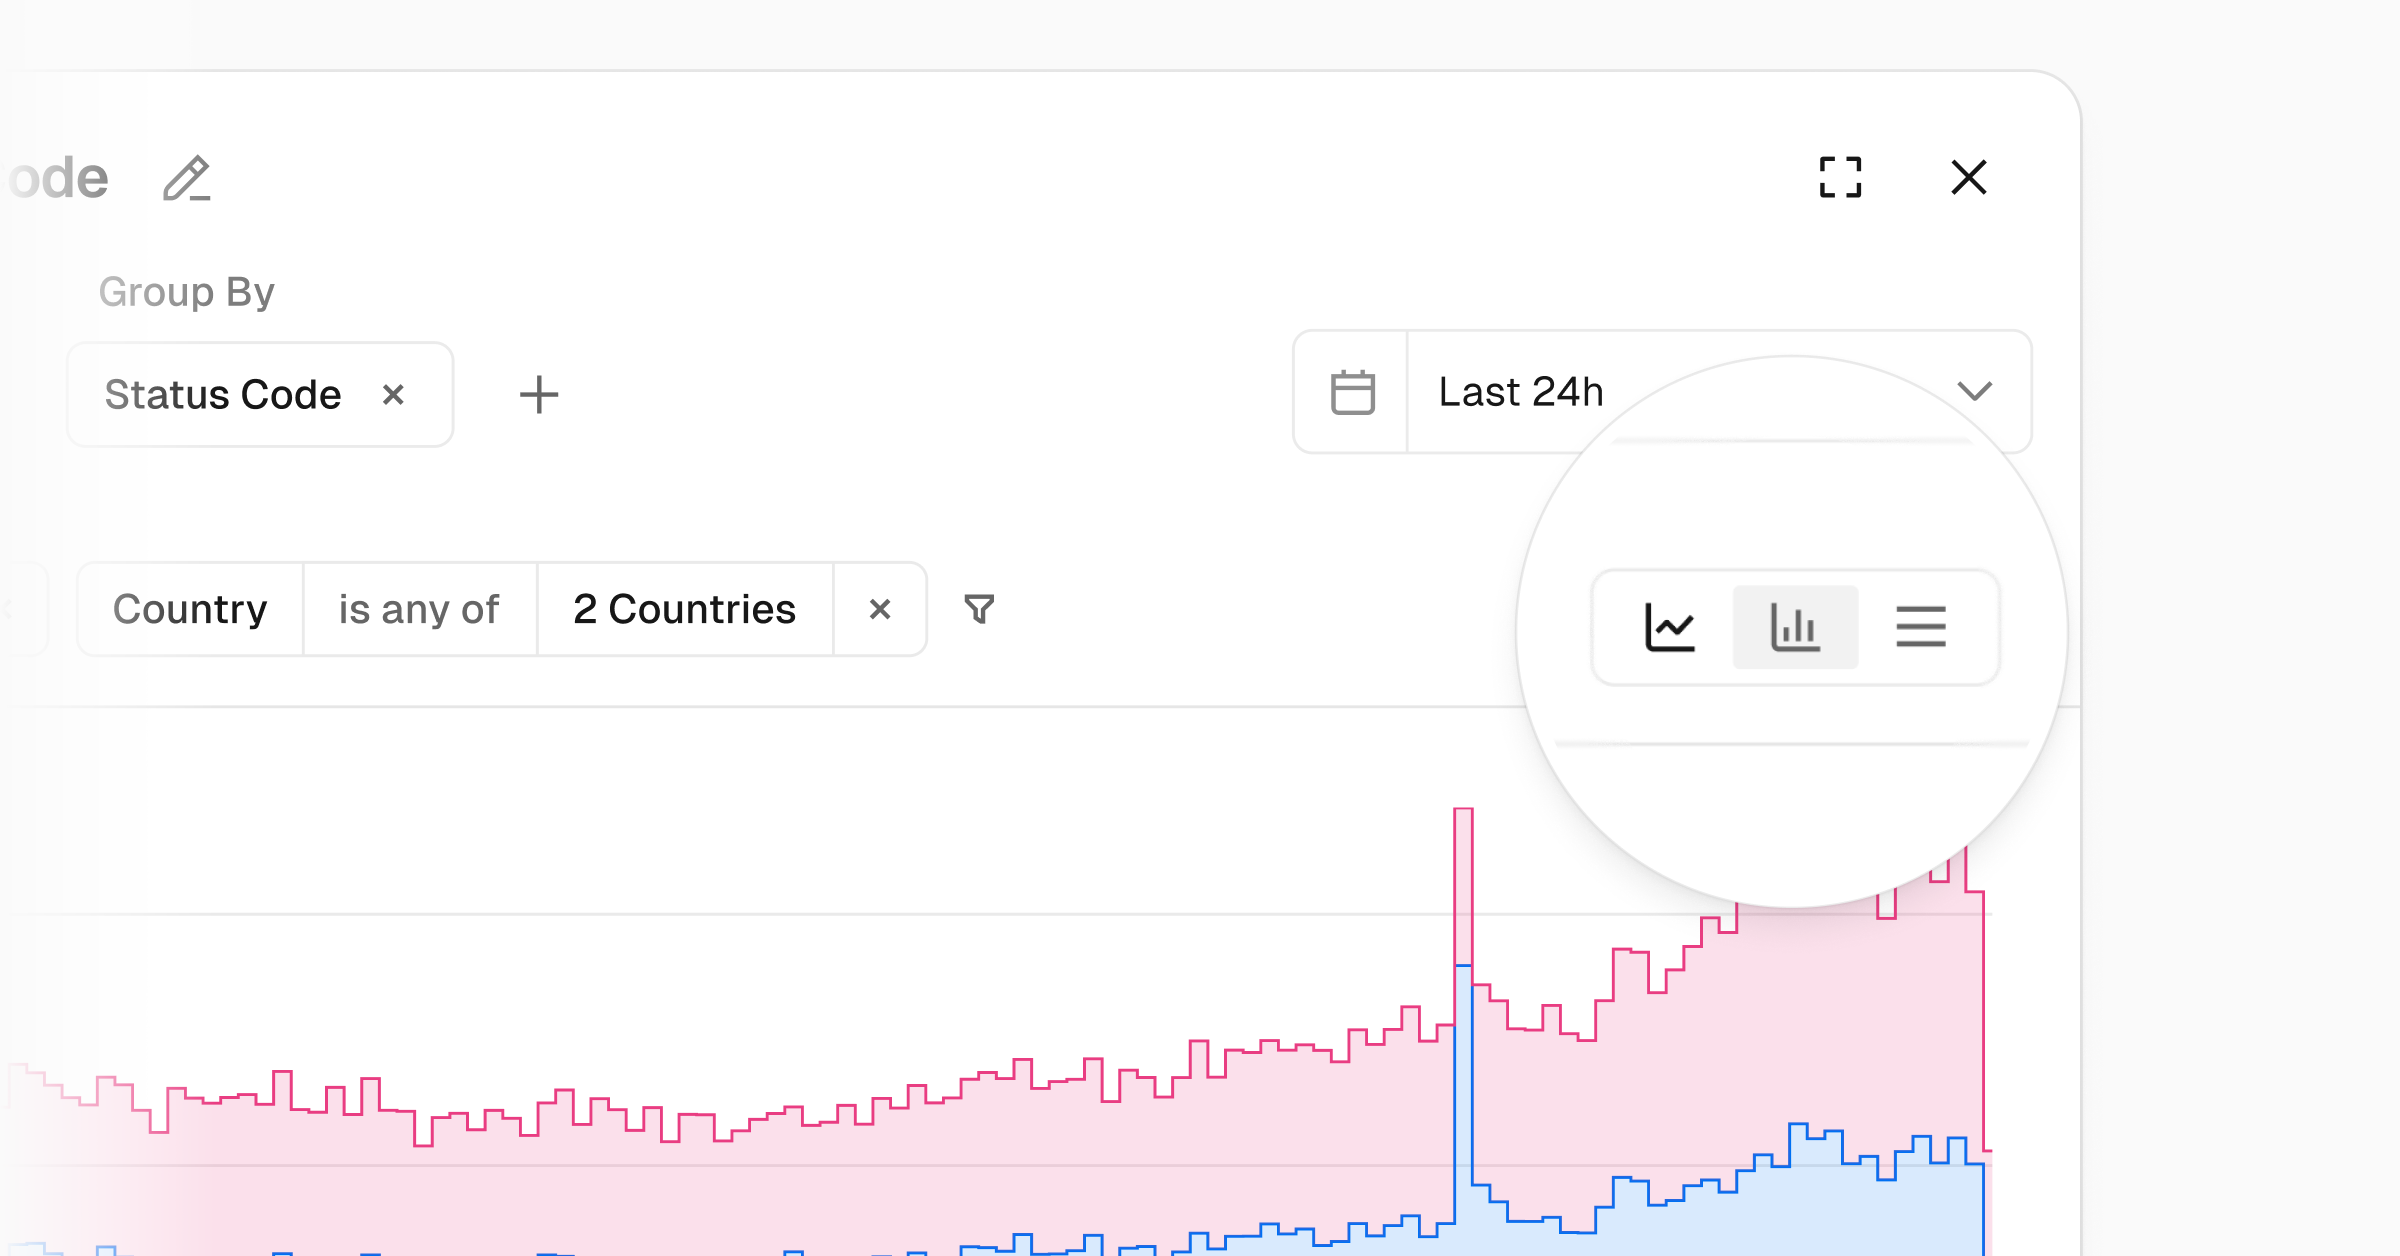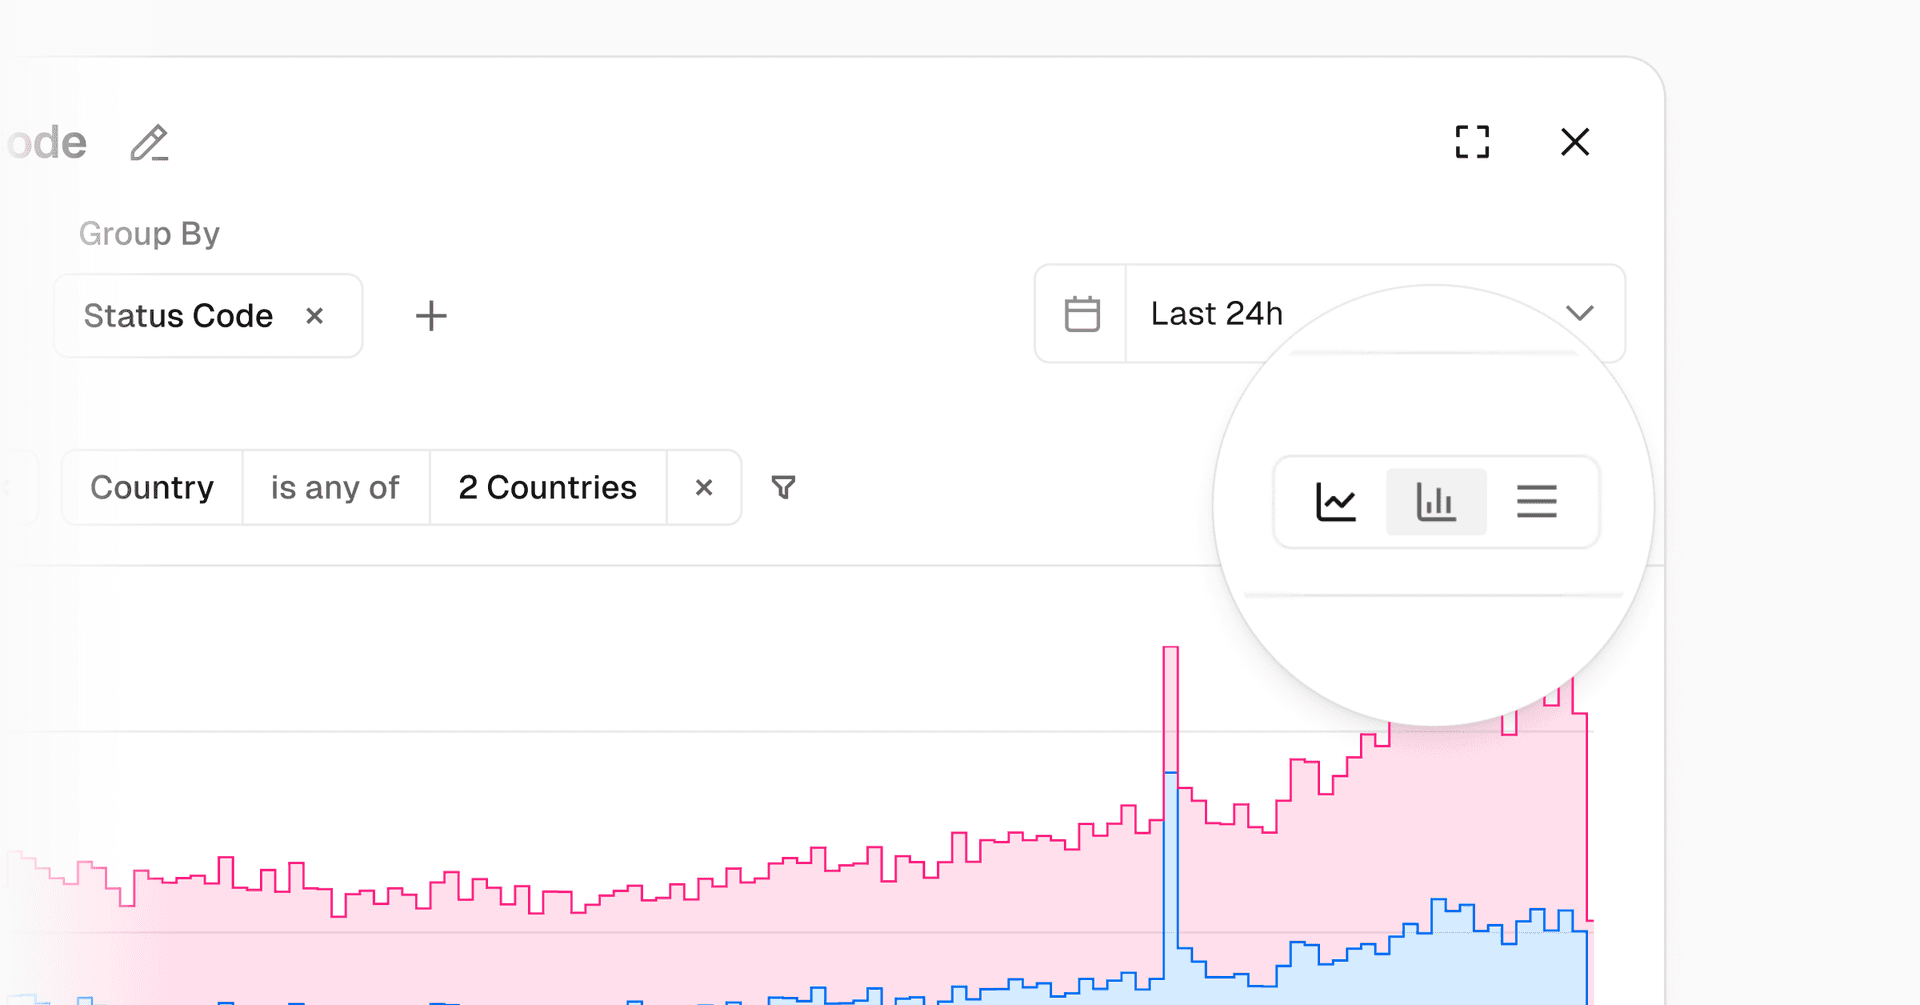
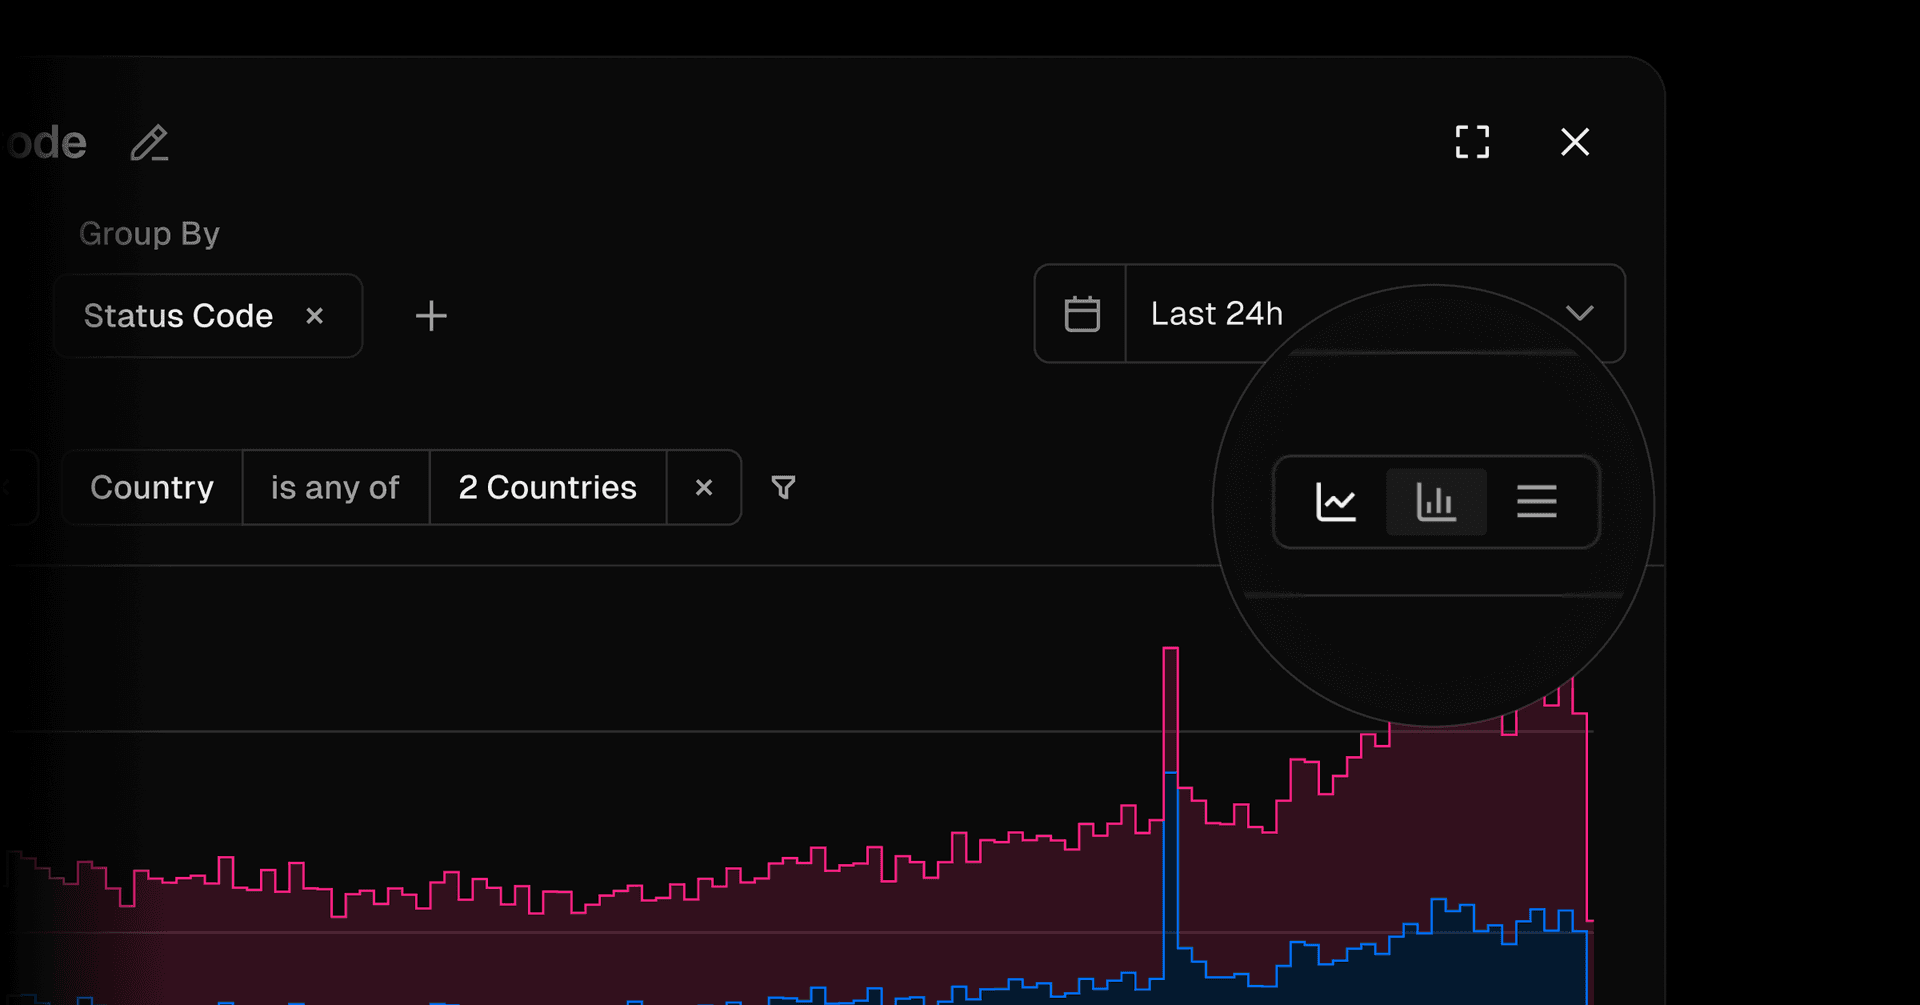
Observability Plus users can now choose between line charts, volume charts, tables, or a big number when visualizing data returned by queries. Both the queries and their visualization settings can be saved to shareable notebooks.
This update replaces fixed presets with customizable controls and is available now at no extra cost for teams on Observability Plus.
Try it out or learn more about Observability and Observability Plus.